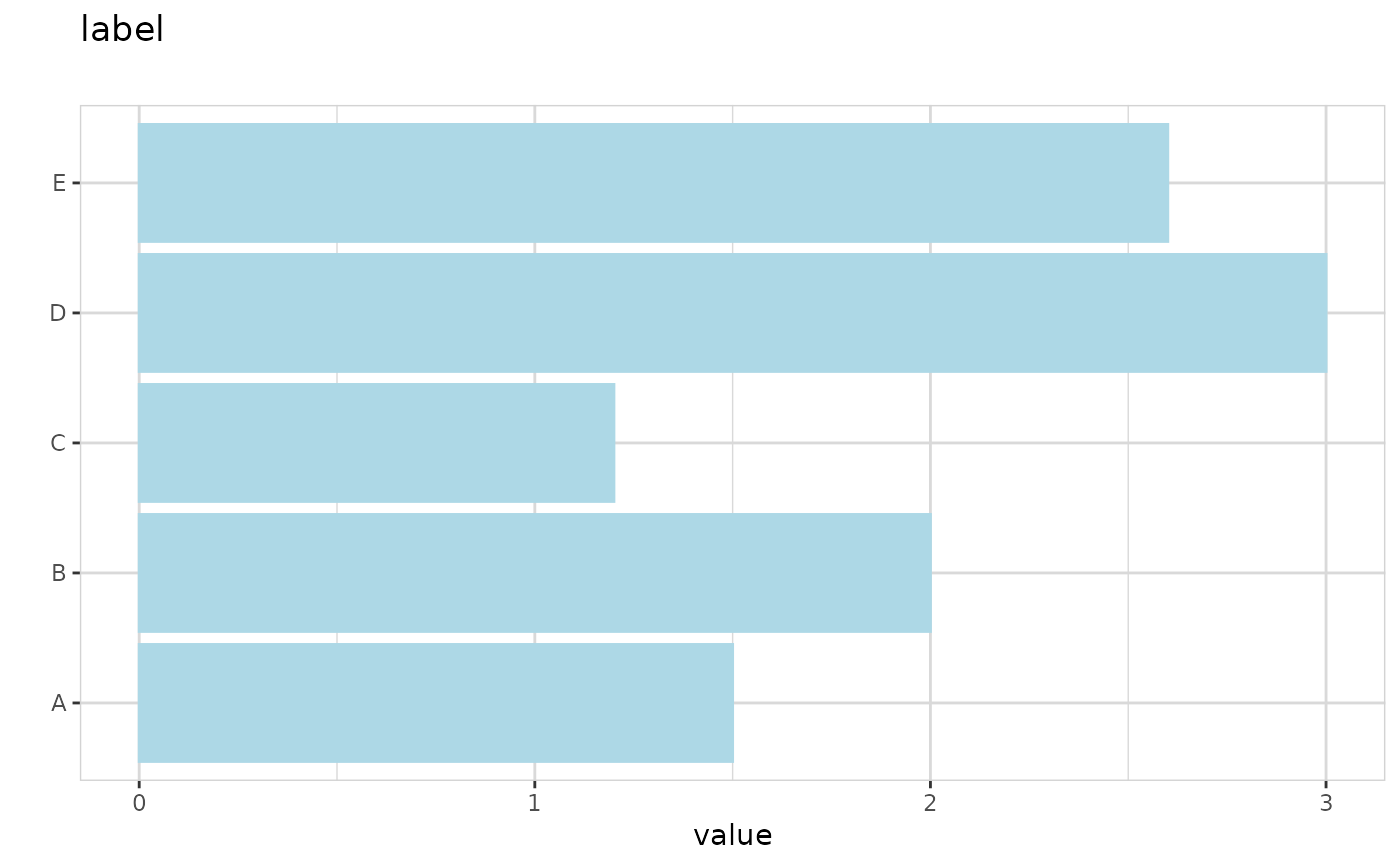
Label and Value are in the data. Create a bar plot where the heights of the bars represent the values for each label.
Usage
explore_col(
  data,
  var_label,
  var_value,
  title = NA,
  subtitle = "",
  numeric = FALSE,
  max_cat = 30,
  na = 0,
  flip = NA,
  color = "#ADD8E6"
)
Arguments
- data
A dataset (categories + frequency)
- var_label
Variable containing the label
- var_value
Variable containing the value
- title
Title of the plot
- subtitle
Subtitle of the plot
- numeric
Display variable as numeric (not category)
- max_cat
Maximum number of categories to be plotted
- na
Value to use for NA
- flip
Flip plot? (for categorical variables)
- color
Color for bar
Examples
library(magrittr)
data <- data.frame(label = LETTERS[1:5], value = c(1.5,2,1.2,3,2.6))
data %>% explore_col(label, value)