Simplifies Exploratory Data Analysis:
-
Interactive data exploration:
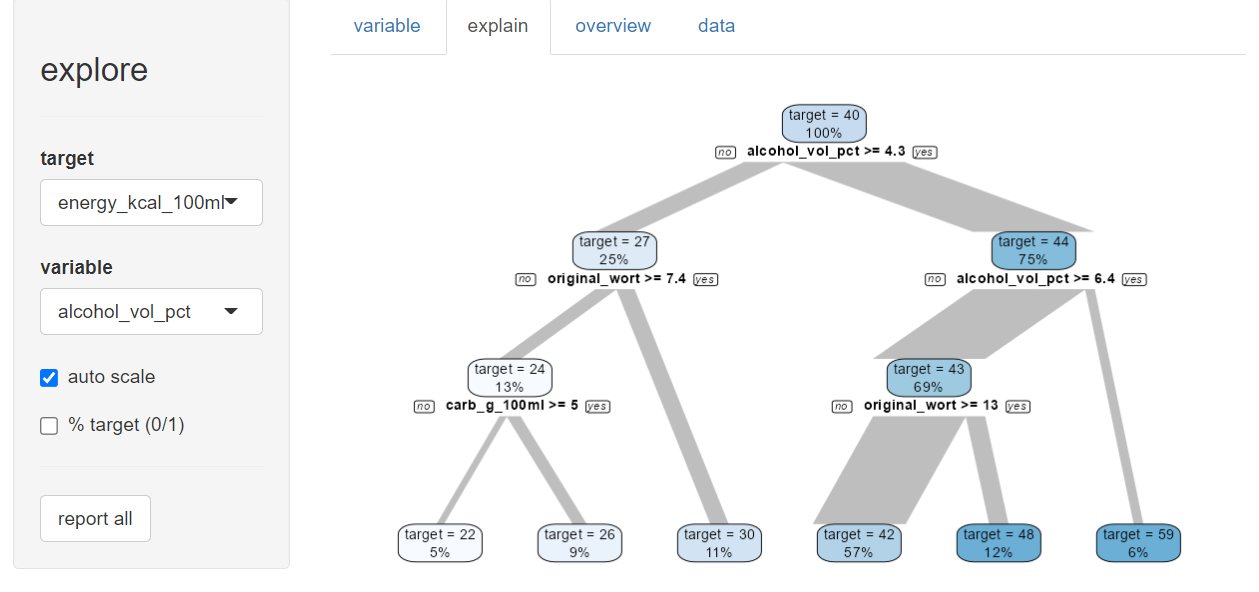
explore() - Use AI to unveil hidden patterns in your data (xgboost, RF, logreg, DT):
explain_*() - Generate an automated report of your data (or patterns in your data):
report() -
Manual exploration:
explore(),describe(),explain_*(),abtest(), … - 18 ready to use datasets for teaching & testing:
use_data_*(),create_data_*()
# install from CRAN
install.packages("explore")
Examples
# interactive data exploration
library(explore)
beer <- use_data_beer()
beer |> explore()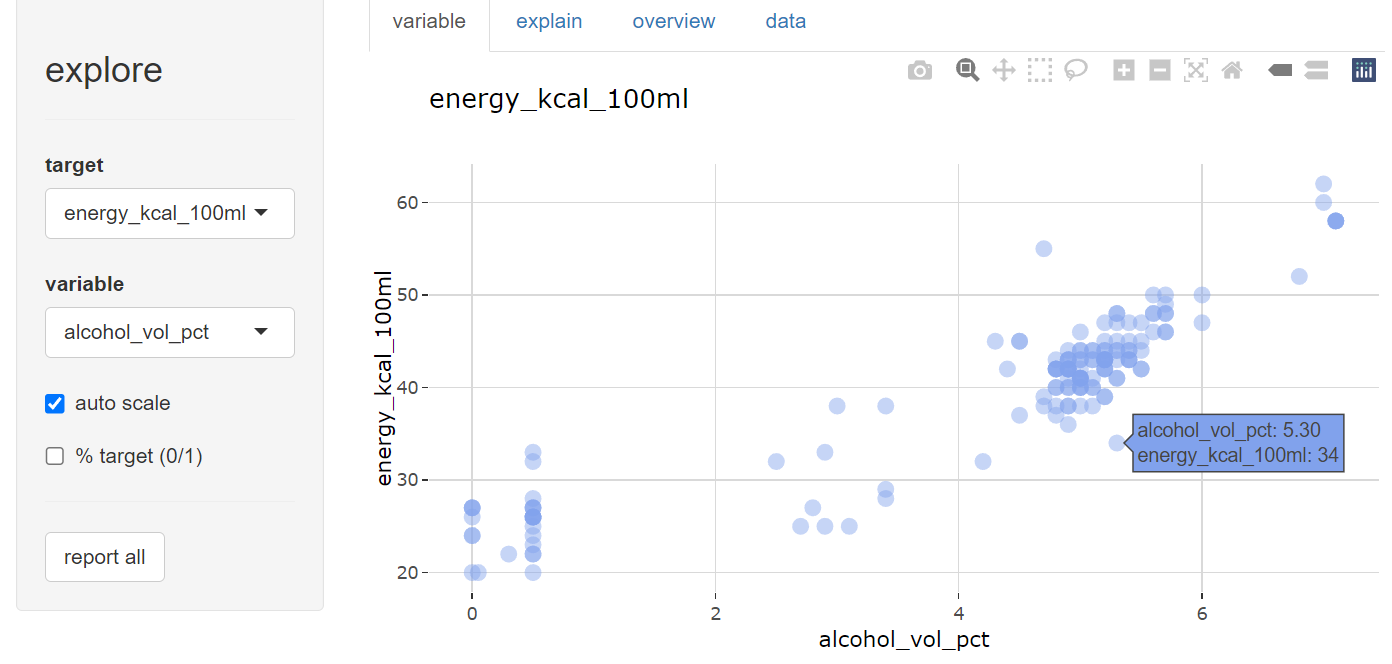
# describe data
beer |> describe()
# A tibble: 11 × 8
variable type na na_pct unique min mean max
<chr> <chr> <int> <dbl> <int> <dbl> <dbl> <dbl>
1 name chr 0 0 161 NA NA NA
2 brand chr 0 0 29 NA NA NA
3 country chr 0 0 3 NA NA NA
4 year dbl 0 0 1 2023 2023 2023
5 type chr 0 0 3 NA NA NA
6 color_dark dbl 0 0 2 0 0.09 1
7 alcohol_vol_pct dbl 2 1.2 35 0 4.32 8.4
8 original_wort dbl 5 3.1 54 5.1 11.3 18.3
9 energy_kcal_100ml dbl 11 6.8 34 20 39.9 62
10 carb_g_100ml dbl 16 9.9 44 1.5 3.53 6.7
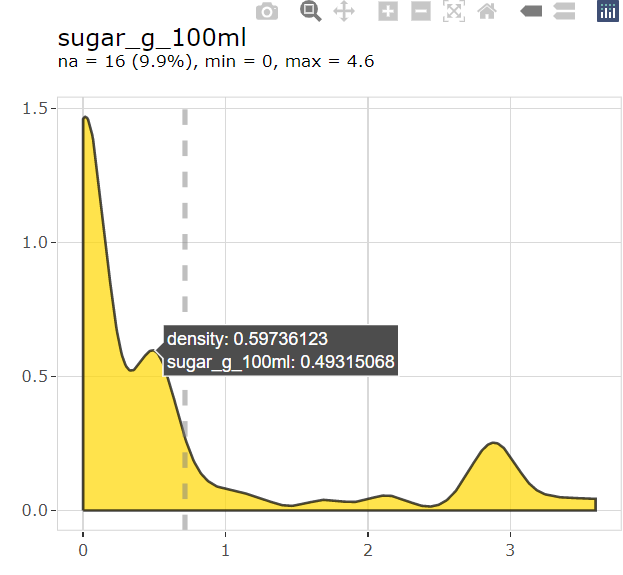
11 sugar_g_100ml dbl 16 9.9 26 0 0.72 4.6
# explore data manually
beer |> explore(type)
beer |> explore(energy_kcal_100ml)
beer |> explore(energy_kcal_100ml, target = type)
beer |> explore(alcohol_vol_pct, energy_kcal_100ml, target = type)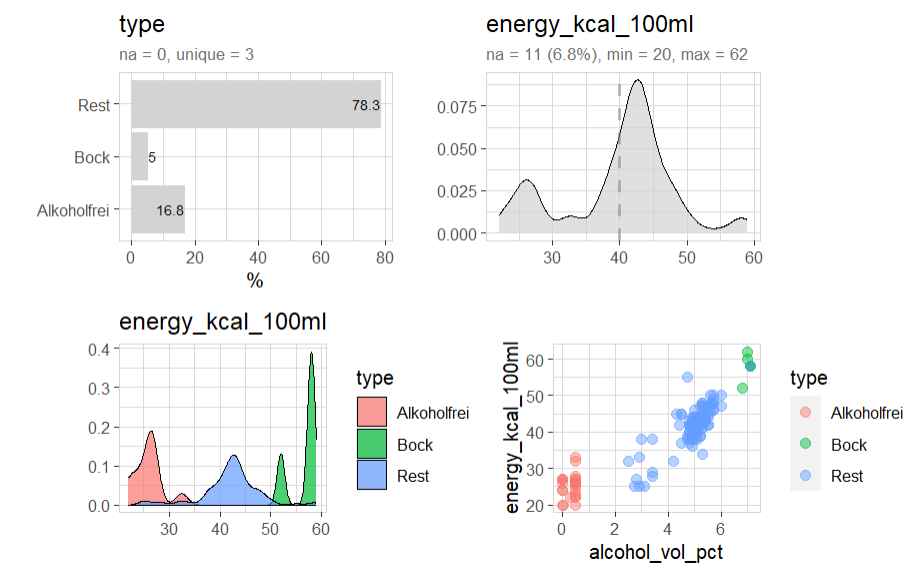
# explore manually with color and interactive
beer |>
  explore(sugar_g_100ml, color = "gold") |>
  interact()