Explore all variables of a dataset (create plots)
Usage
explore_all(
  data,
  n,
  target,
  ncol = 2,
  targetpct,
  color = c("#ADD8E6", "#7BB8DA"),
  split = TRUE
)Examples
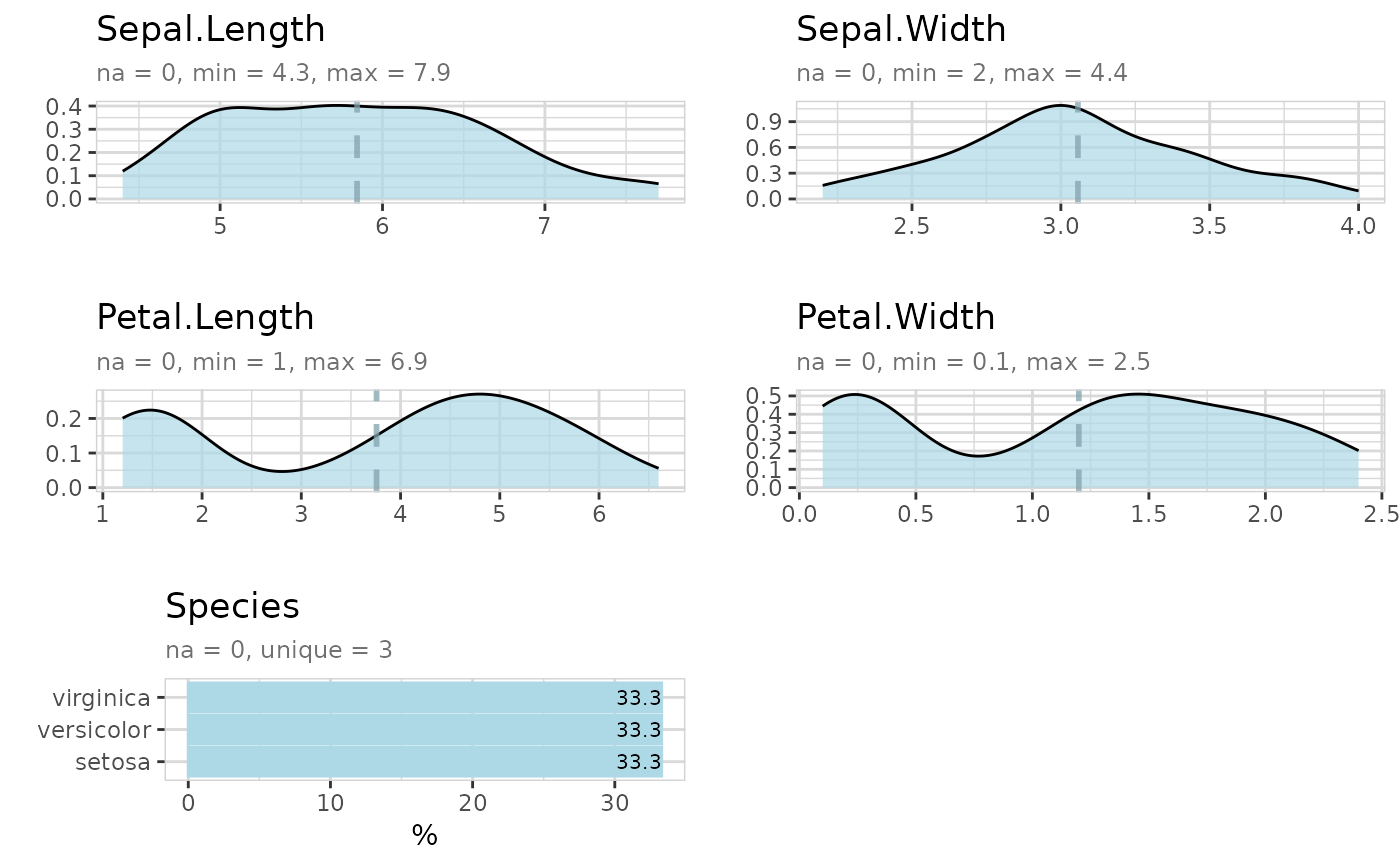
explore_all(iris)
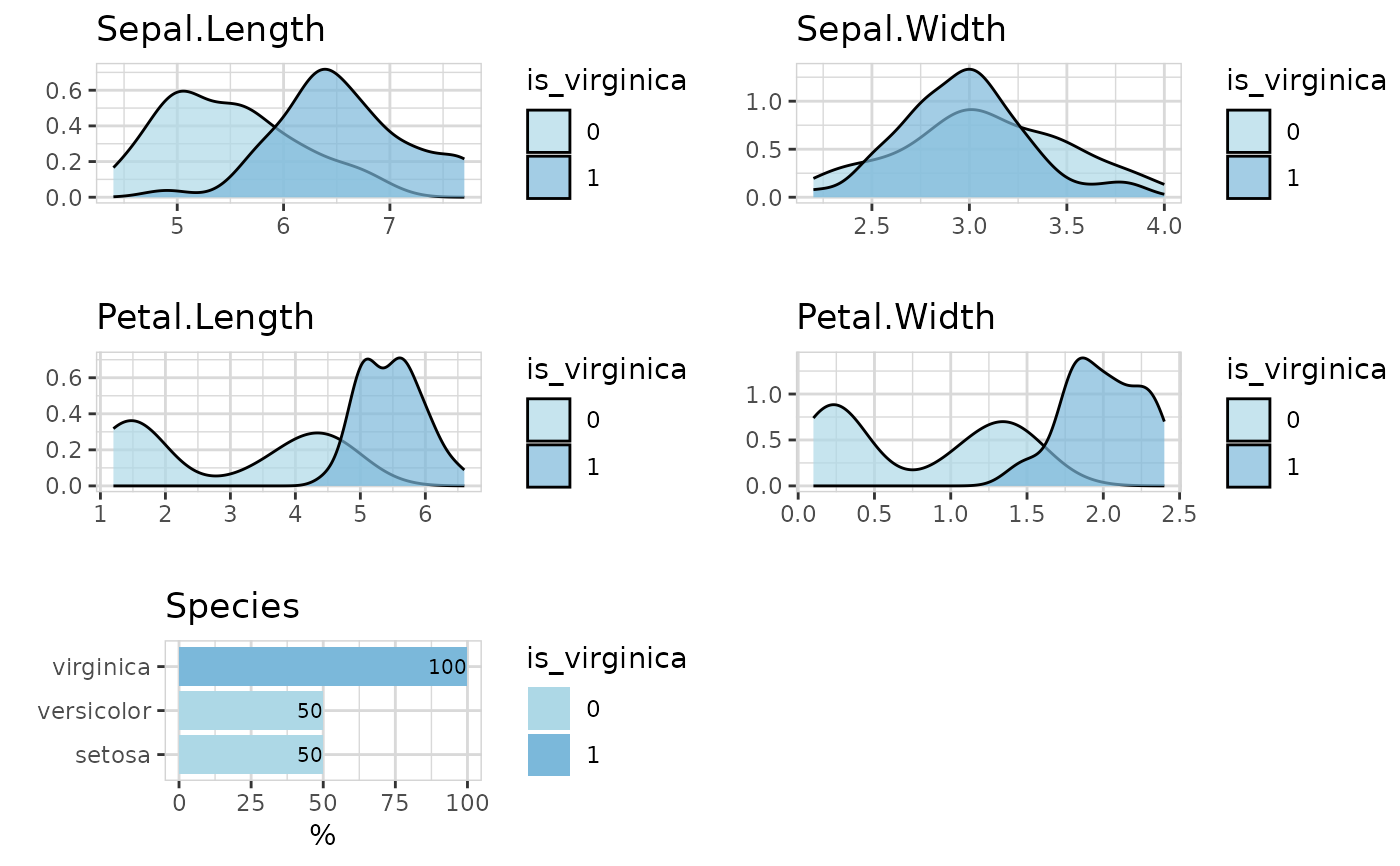
 iris$is_virginica <- ifelse(iris$Species == "virginica", 1, 0)
explore_all(iris, target = is_virginica)
iris$is_virginica <- ifelse(iris$Species == "virginica", 1, 0)
explore_all(iris, target = is_virginica)