
start to {explore}
What if exploring data in R is just one line of code?
explore(data)
R would be so much more attractive to people that are used to do data analytics with Excel or a GUI based statistic tool!
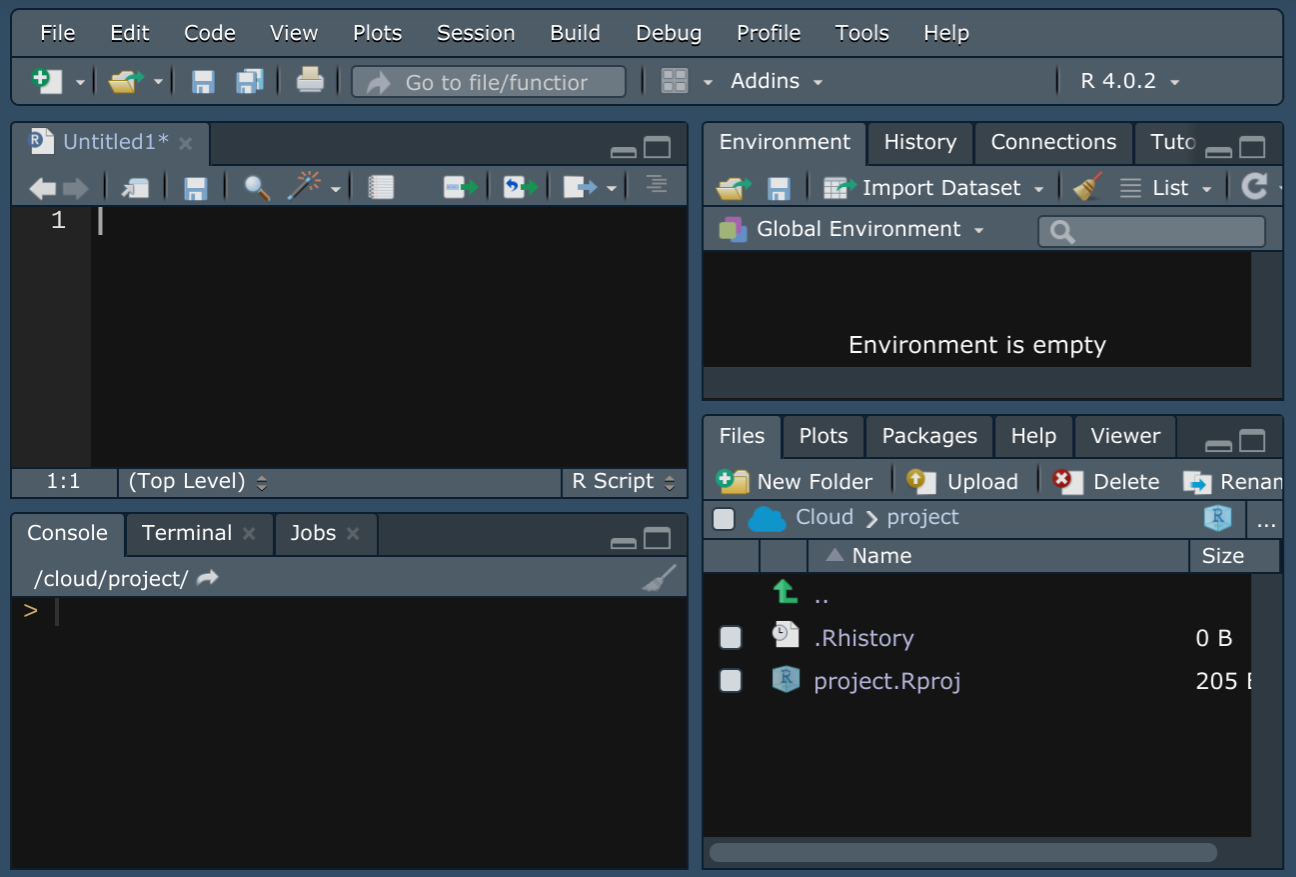
I really apprechiate the power of coding, but for fresh new R users stepping into coding is not easy. If you start RStudio for the first time, there is not much you can do by just “playing around”. You may be able to import a dataset by using the “Import Dataset” button at the Environment pane. But then if you want to do some basic statistics or create some basic plots, you fail because the IDE is not offering any direct support.
In a typical introduction to data exploration in R for beginners, you are confronted with more than 25 function names:
library(), getwd(), setwd(), c(), data(), data.frame(), read.csv(), str(), head(), tail(), summary(), table(), ggplot(), aes(), geom_point(), geom_bar(), geom_boxplot(), geom_density(), coord_flip(), labs(), theme_light(), select(), filter(), mutate(), summarize(), group_by(), arrange(), …
But cognitive psychology proved, that humans can only keep about 7 new objects in memory (The magical number 7, by George A. Miller) So you are not able to do the very basic stuff without learning quite a number of different concepts and functions the hard way first. That may be frustrating and feels like a “step backwards” coming from a GUI.
I believe using R for the first time should feel like getting new exciting toys you instantly want to use and play with.
Thats why I wrote the {explore} package!
Interactive Data Science
For example, to explore the penguins dataset you just need 3 easy to understand lines of code:
library(palmerpenguins)
library(explore)
explore(penguins)
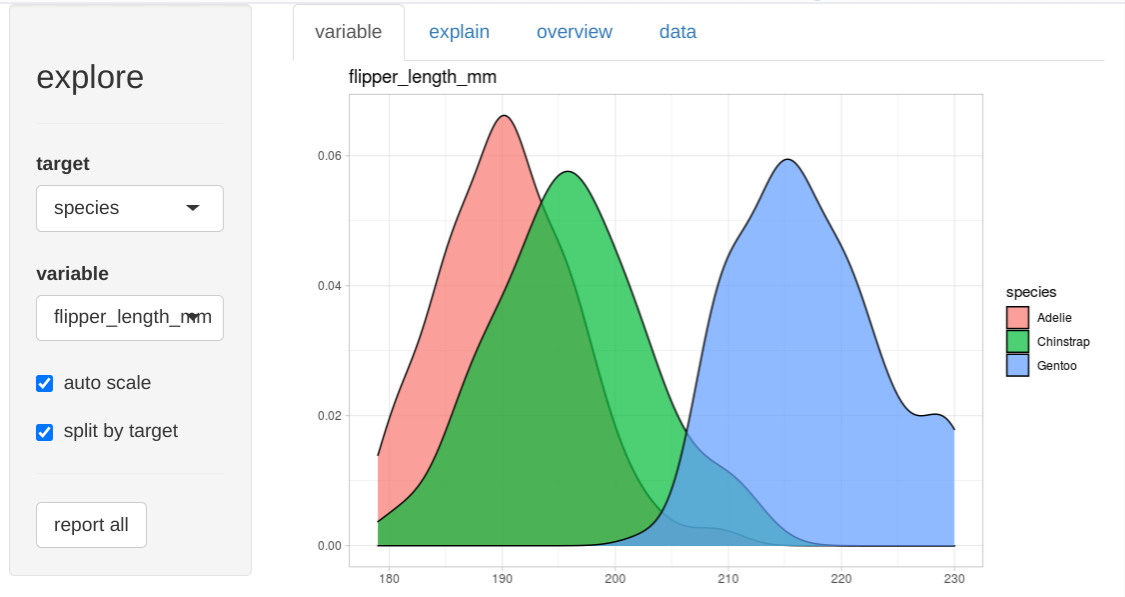
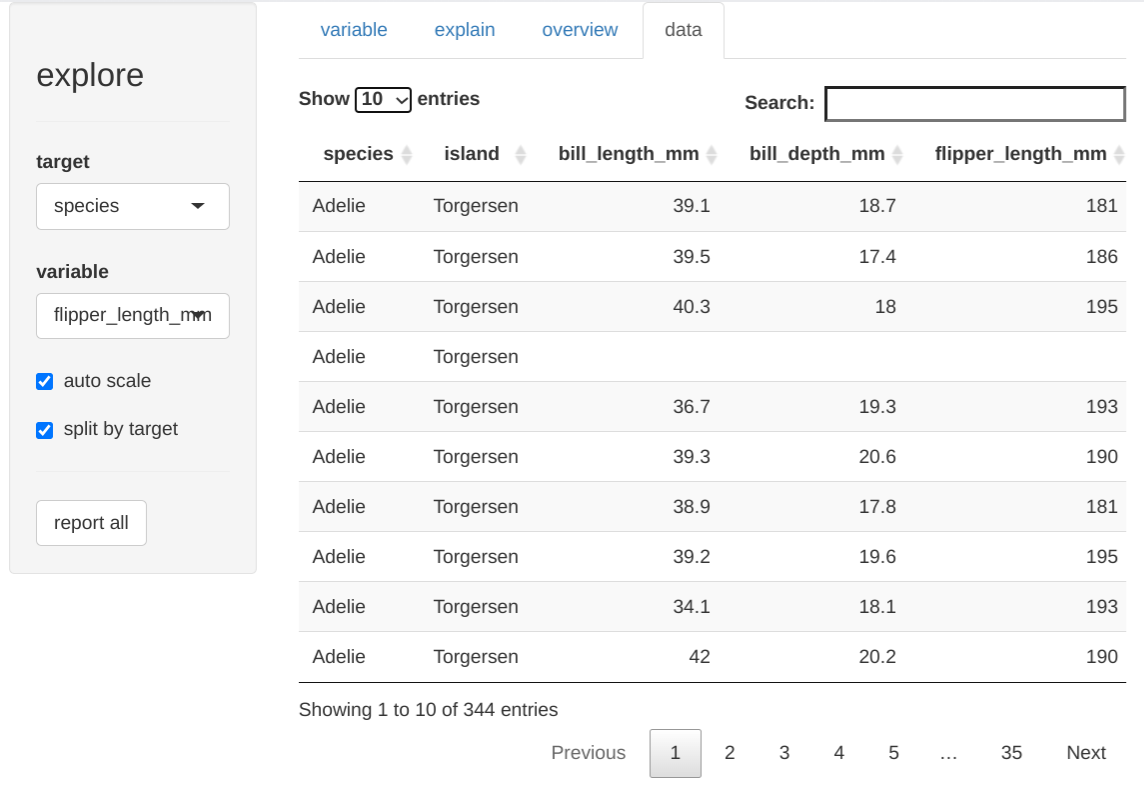
This will launch a Shiny App that enables you to explore data with just a few mouse clicks!
The variable tab lets you explore a variable and its relation to a target
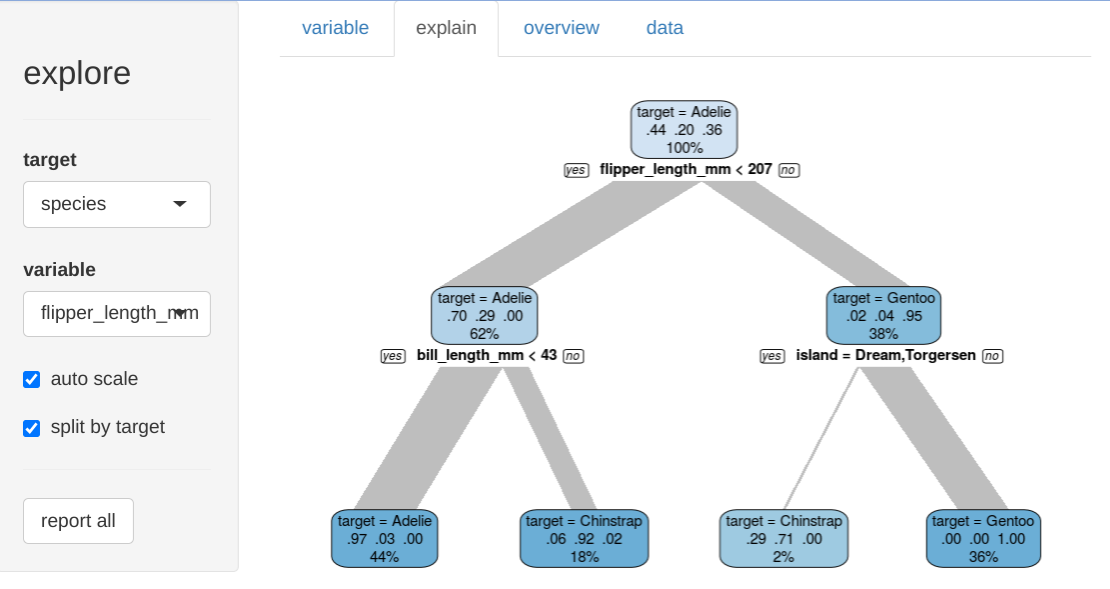
The explain tab shows a decision tree explaining the target
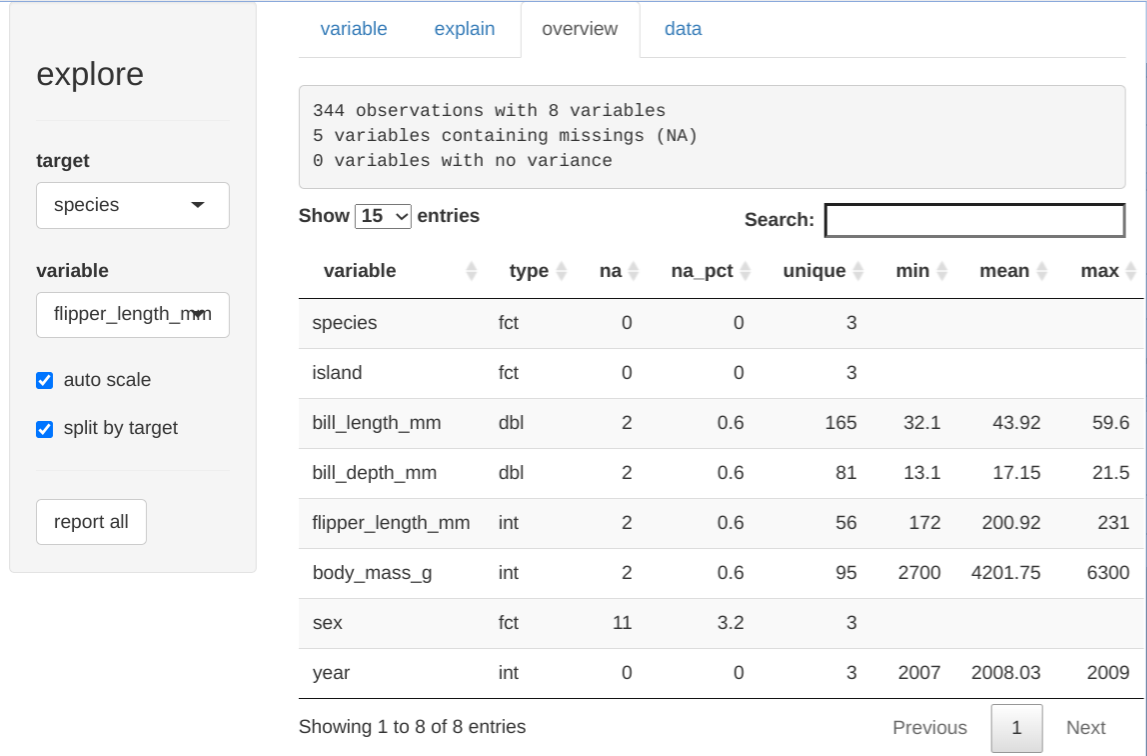
The overview tab describes all variables, their type, NA-values, min, max …
The data tab view the raw data
Automated Reports
Furthermore you can create different types of rich HTML-reports of your data by clicking the “report all” button.
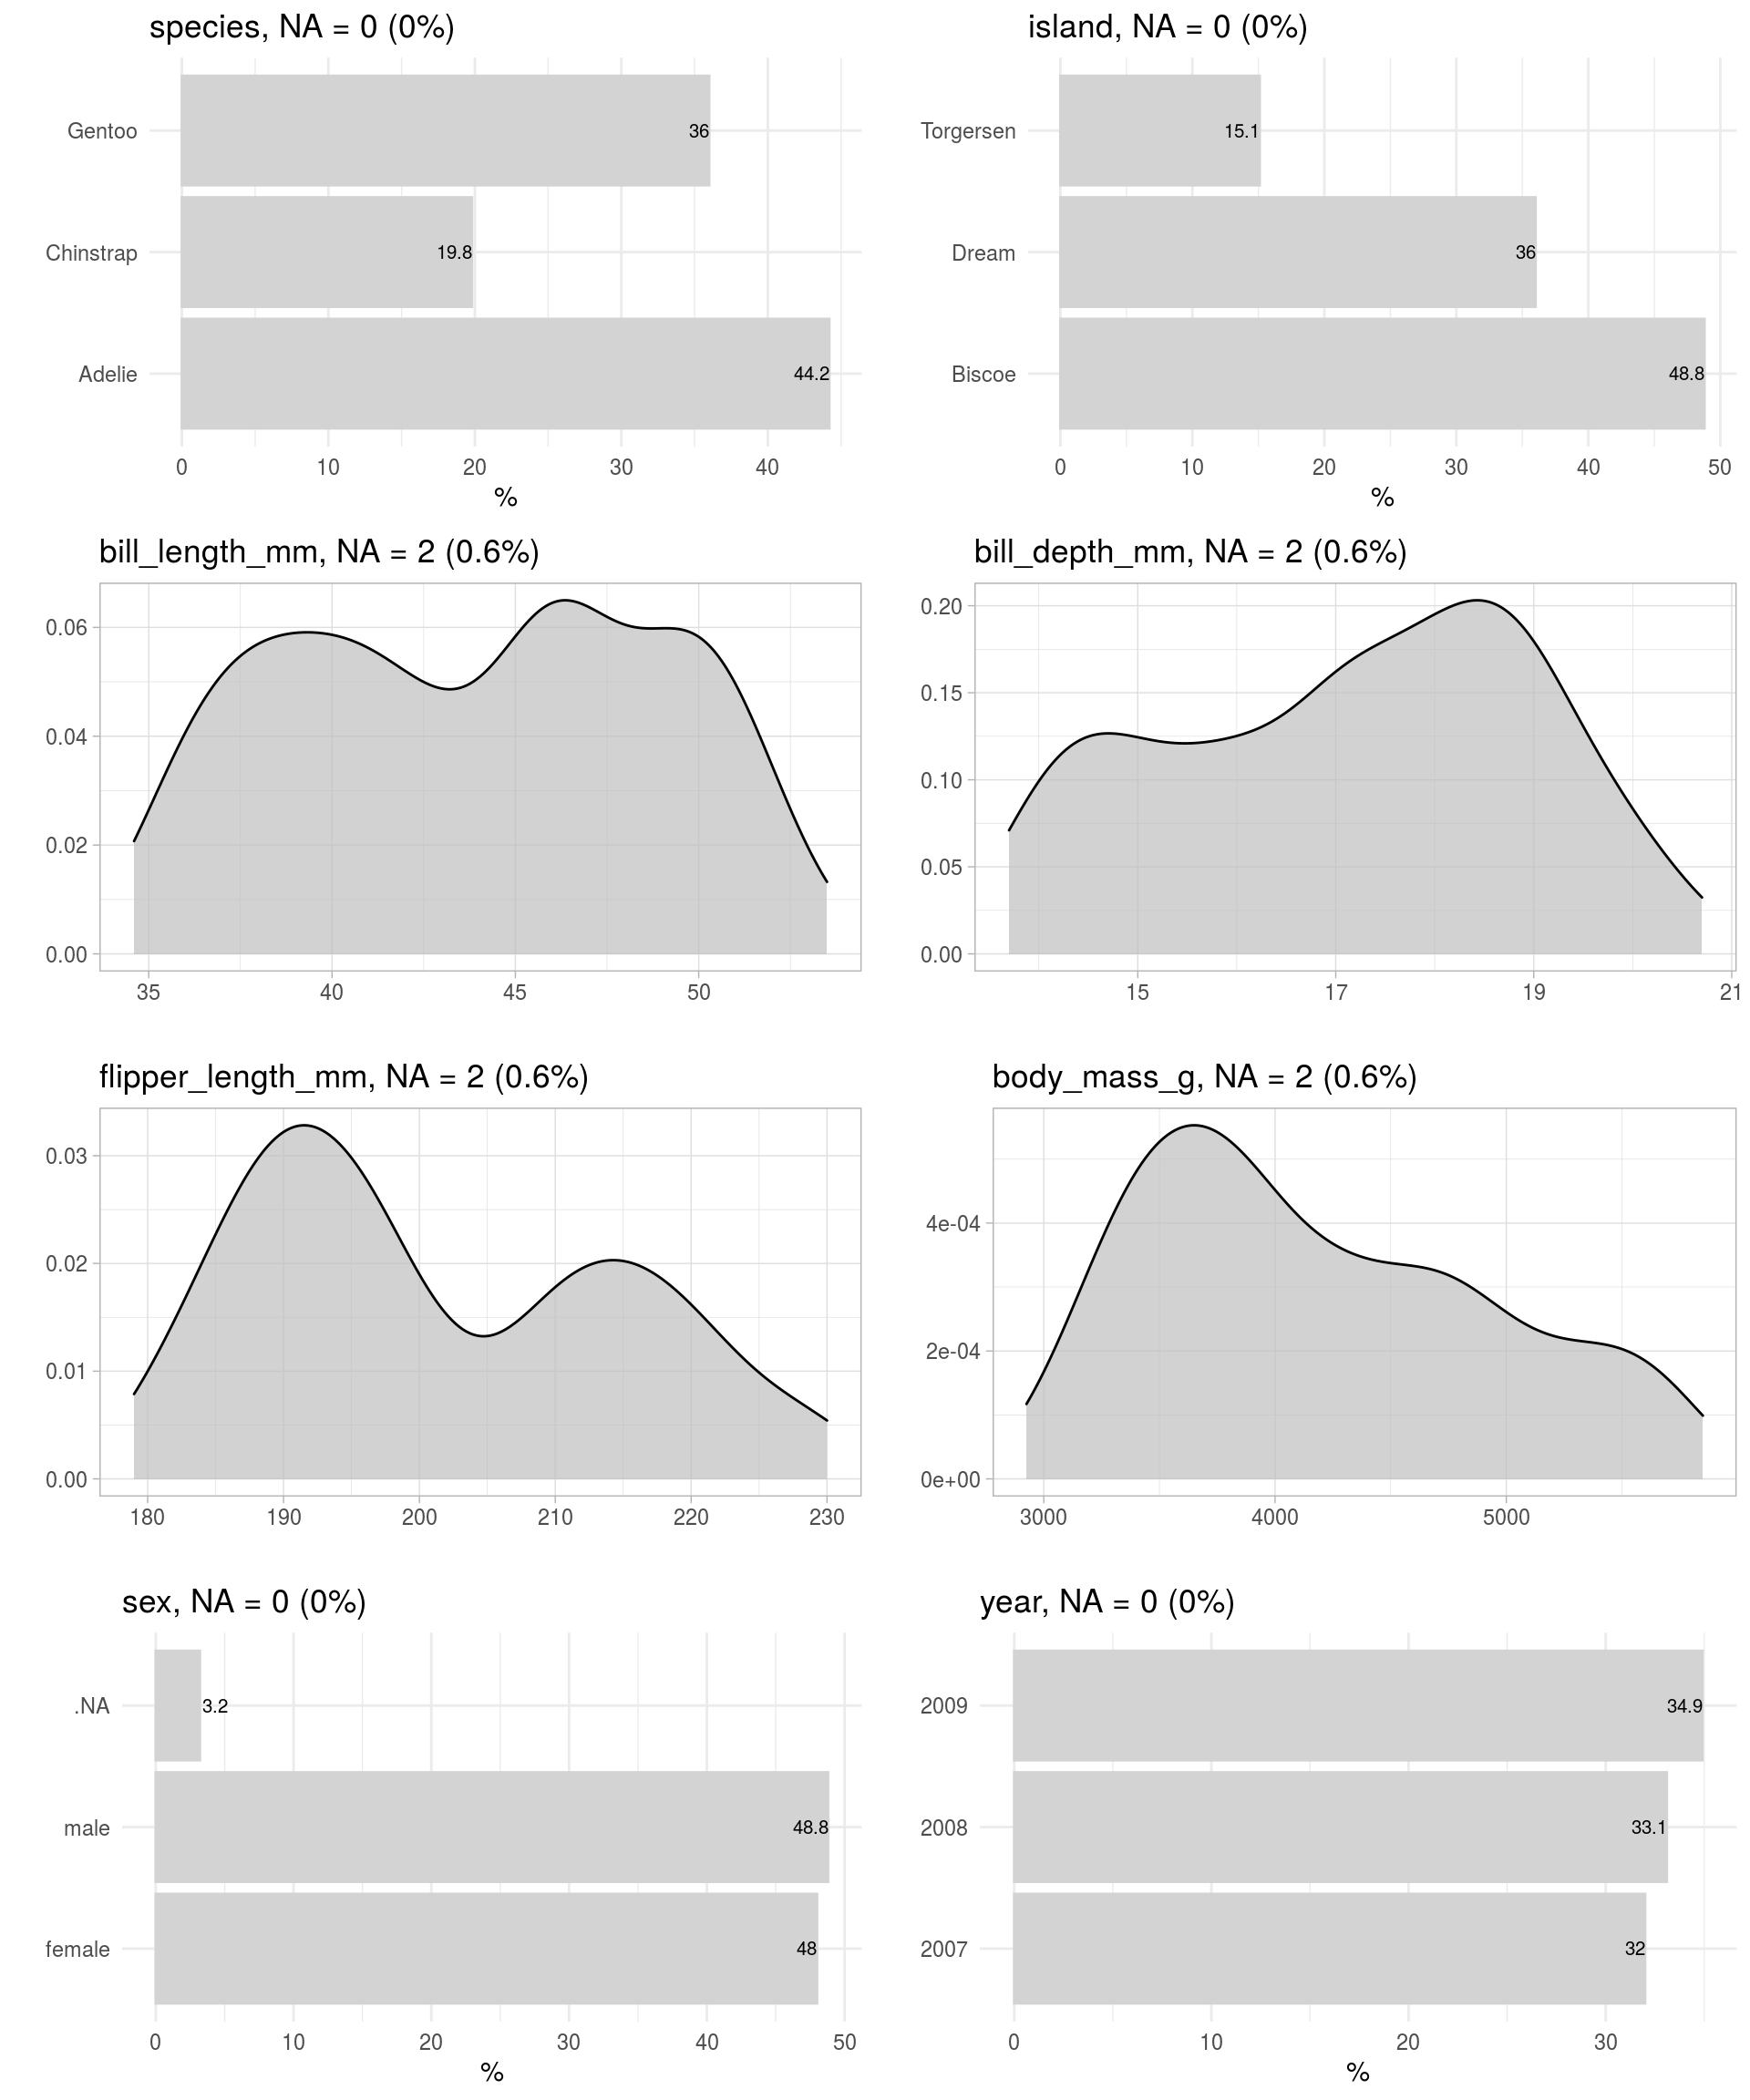
If no target is defined, you get a report of all the variables
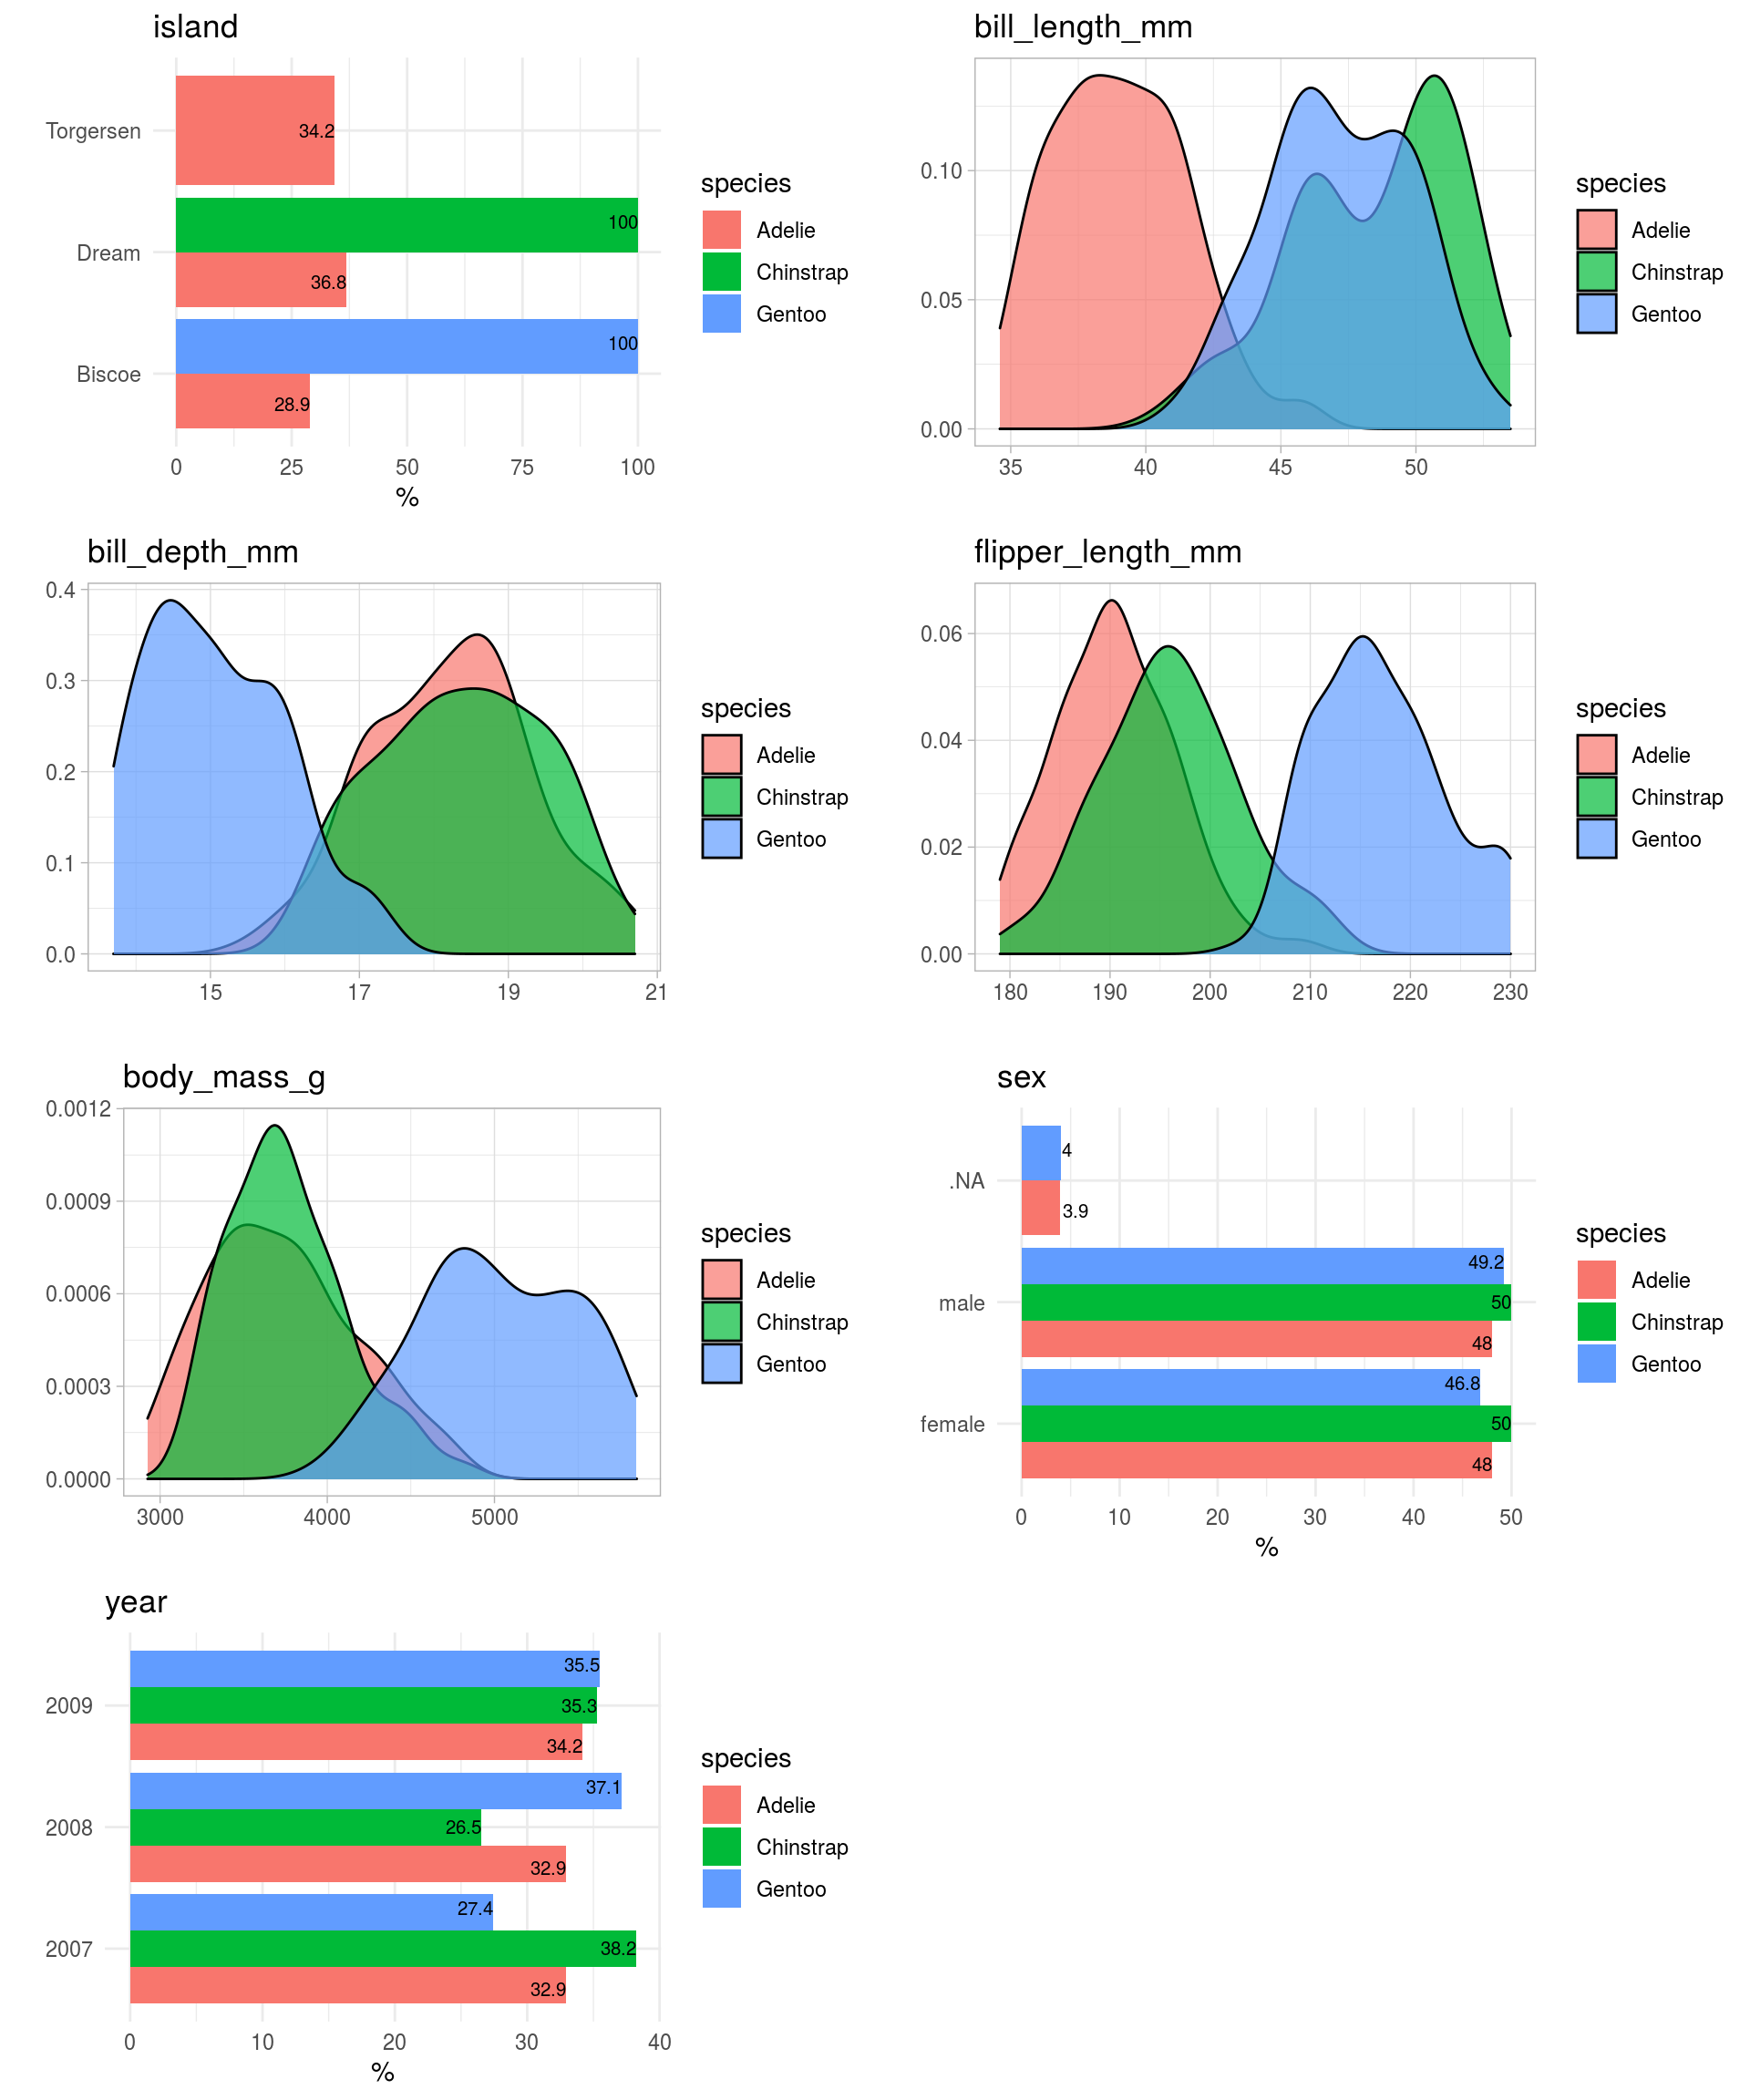
If a target is defined, you get a report of the relation between all variables and the target.
Reproducible Data Science
Of course you can unleash the full power of R only using code, so the {explore} package offers all functionality of the GUI as extremely easy to use R functions to step into coding:
explore(), describe(), report(), explain_tree(), …
# prepare
library(dplyr)
library(explore)
library(palmerpenguins)
Describe data: (output is a tibble)
describe(penguins)
# A tibble: 8 x 8
  variable          type     na na_pct unique    min   mean    max
  <chr>             <chr> <int>  <dbl>  <int>  <dbl>  <dbl>  <dbl>
1 species           fct       0    0        3   NA     NA     NA
2 island            fct       0    0        3   NA     NA     NA
3 bill_length_mm    dbl       2    0.6    165   32.1   43.9   59.6
4 bill_depth_mm     dbl       2    0.6     81   13.1   17.2   21.5
5 flipper_length_mm int       2    0.6     56  172    201.   231
6 body_mass_g       int       2    0.6     95 2700   4202.  6300
7 sex               fct      11    3.2      3   NA     NA     NA
8 year              int       0    0        3 2007   2008.  2009
Explore variables: (output is a plot)
# explore variable
penguins %>% explore(island)
penguins %>% explore(flipper_length_mm)

# explore relationship with target
penguins %>% explore(island, target = species)
penguins %>% explore(flipper_length_mm, target = species)
Create a Decision Tree: (output is the tree plot)
penguins %>% explain_tree(target = species)
Conclusion
Interactive Data Exploration helps new users to step into R.
To get more options and possibilities these users will switch to coding using just a handful of simple functions of the {explore} package.
After a while these new R users will naturally go into the direction of reproducible datascience with rmarkdown and will discover new packages like {dplyr}, {ggplot2}, {tidyr}
So I believe the {explore} package offers an easy learning path, specially for people coming from a GUI, to have a successful start with R and stay with it in the long run.
Let’s explore! https://github.com/rolkra/explore