
Never trust an average!
Averages are very common. But can we trust them?
What is an average?
In daily life we use “average” as a single number taken as representative of a list of numbers. In mathematics they are often called “mean”. The mathematical definition of average (mean) is:
average = the sum of the values / the number of values
50 people in a bus

Let’s start with an example: There are 50 people in a bus. Let’s assume they are kids, and most of them are in the age between 6 and 8.
set.seed(123)  # to make it reproducible
people <- data.frame(age = rnorm(50, mean = 7, sd = 1))
To explore the data we are using {tidyverse} and {explore}
library(tidyverse)
library(explore)
To calculate the average age of the people we can use the describe() function of {explore}.
people %>% describe(age)
## variable = age
## type     = double
## na       = 0 of 50 (0%)
## unique   = 50
## min|max  = 5.033383 | 9.168956
## q05|q95  = 5.734754 | 8.644704
## q25|q75  = 6.440683 | 7.698177
## median   = 6.9
## mean     = 7.034404
So the average age (mean) is 7 years. We can plot the age distribution using explore()
people %>%
  explore(age, title = "Distribution of age and its mean") +
  geom_vline(xintercept = 7.03, color = "red")
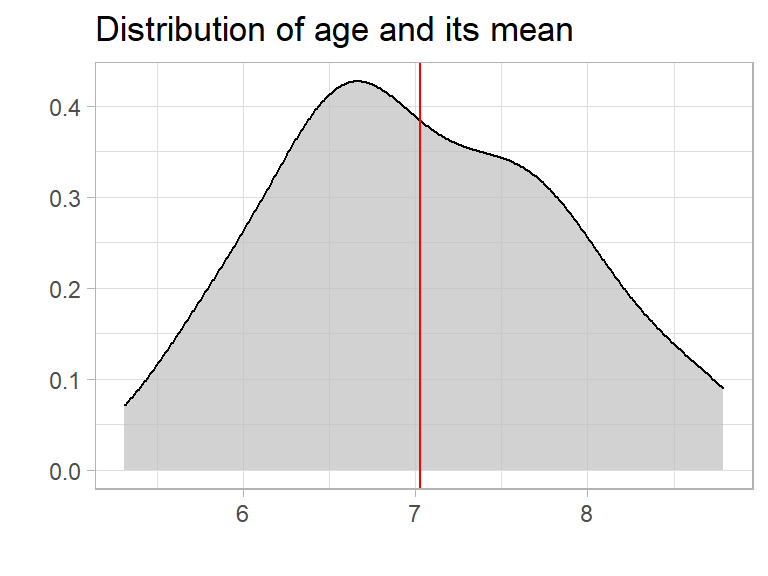
So if you tell someone that there is a bus arriving with 50 people 7 year old in average, they will think of 50 kids about 7 years old. And thats pretty ok. Even if the kids are actually between 5 and 9 years old, one single number (the average) helps to understand the whole group of people. Awesome!
The bus driver!
But wait! We forgot the bus driver. Let’s say he is 60 years old. How does that change the average?
people <- people %>% add_row(age = 60)
people %>% describe(age)
## variable = age
## type     = double
## na       = 0 of 51 (0%)
## unique   = 51
## min|max  = 5.033383 | 60
## q05|q95  = 5.734771 | 8.750989
## q25|q75  = 6.441842 | 7.740661
## median   = 6.9
## mean     = 8.072945
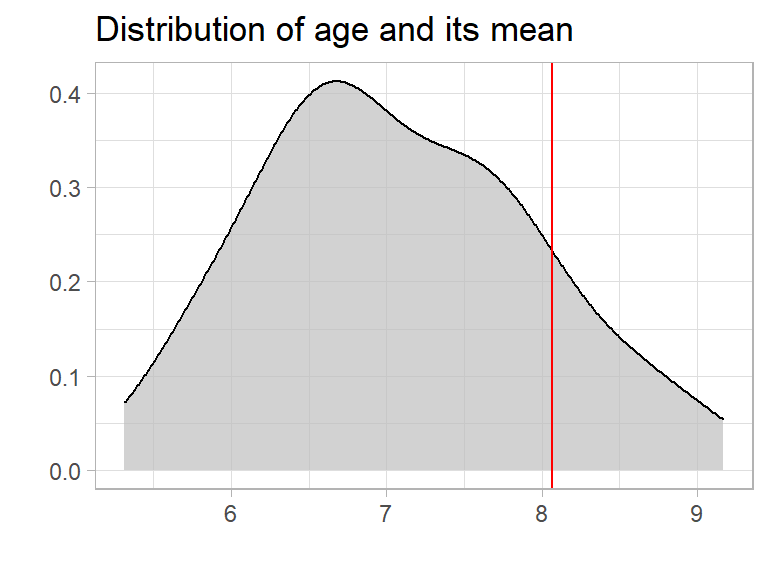
The average (mean) is increasing from 7 to 8 years. So the average is still useful, as almost all people in the bus are at least kids and the age of 8 years may be a useful orientation. But we may completely miss that there is an adult in the bus.
If we take a look to the distribution we see that the average is moving too much to the right” to be representative for the people.
people %>%
  explore(age, title = "Distribution of age and its mean") +
  geom_vline(xintercept = 8.07, color = "red")
The bug!
But what happens if we don’t have clean data, and we add a person with age 5000? That could happen by mistyping (instead of age 50.00 by missing the “.” )
people <- people %>% add_row(age = 5000)
people %>% describe(age)
## variable = age
## type     = double
## na       = 0 of 52 (0%)
## unique   = 52
## min|max  = 5.033383 | 5 000
## q05|q95  = 5.734788 | 8.958832
## q25|q75  = 6.443 | 7.790369
## median   = 7
## mean     = 104.0715
Just knowing the average age of these people, we expect a group of over 100 year old!

Now we have the situation that the average is completely useless. Non of the real people is even close to 100 years old!
But take a look to the median, which is still 7!
Conclusion
Never trust an average!
One single extreme value can “destroy” the value of an average. If you base important decisions just on averages, there is high danger of failing. Use median instead or take a look at the real distribution!