
Sugar in beer? Let´s {explore}!
Let’s dive into beer-data and build an AI that explains sugar in beer!
Setup
If {explore} is not installed, install it from CRAN
install.packages("explore")
Then we simply load the package and use the beer data!
library(explore)
data <- use_data_beer()
Data understanding
Firest, we describe the table:
data |> describe_tbl()
161 observations with 11 variables
19 observations containing missings (NA)
5 variables containing missings (NA)
1 variables with no variance
Then we describe all variables:
data |> describe_all()
# A tibble: 11 x 8
   variable          type     na na_pct unique    min    mean    max
   <chr>             <chr> <int>  <dbl>  <int>  <dbl>   <dbl>  <dbl>
 1 name              chr       0    0      161   NA     NA      NA
 2 brand             chr       0    0       29   NA     NA      NA
 3 country           chr       0    0        3   NA     NA      NA
 4 year              dbl       0    0        1 2023   2023    2023
 5 type              chr       0    0        3   NA     NA      NA
 6 color_dark        dbl       0    0        2    0      0.09    1
 7 alcohol_vol_pct   dbl       2    1.2     35    0      4.32    8.4
 8 original_wort     dbl       5    3.1     54    5.1   11.3    18.3
 9 energy_kcal_100ml dbl      11    6.8     34   20     39.9    62
10 carb_g_100ml      dbl      16    9.9     44    1.5    3.53    6.7
11 sugar_g_100ml     dbl      16    9.9     26    0      0.72    4.6
So we got 161 beers (29 different brands) from 3 countries. For most of the beers we got most common attributes like alcohol (in volumne percent), original wort, energy (in kcal per 100 ml), and so on. Let’s take a closer look to some of the attributes:
We use {dplyr} for select, all other functions are from {explore}
library(dplyr)
We will use a “beer-like” golden color for the plots, you need {explore} version 1.3 or higher to use the color parameter.
data |>
  select(country, year, type, color_dark) |>
  explore_all(color = "gold")
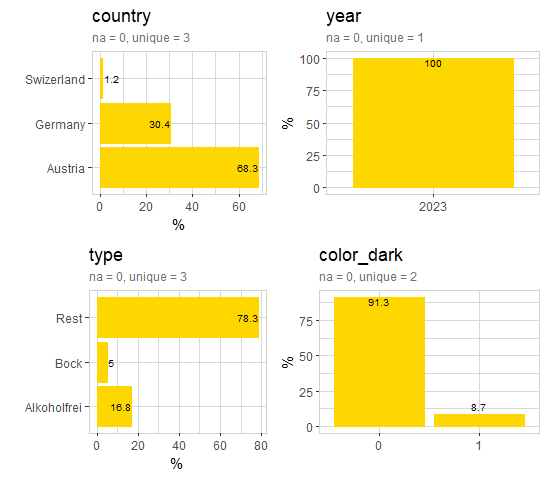
Most of the beers are produced in Austria, some in Germany and Switzerland. All beer-data are collected in 2023. Beer types are “Alkoholfrei”, “Bock” and “Rest. “Rest is the most common beer type. Below 10% of all beers have a dark color.
data |>
  select(alcohol_vol_pct, original_wort, energy_kcal_100ml, carb_g_100ml, sugar_g_100ml) |>
  explore_all(color = "gold")
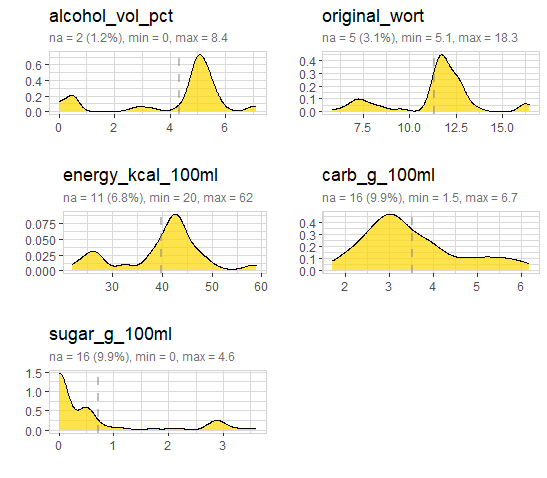
We see, some of the beers actually contain sugar!
Deep Dive
Let’s dive deeper into the data and look for some interesting patterns.
First we check the relationship between alcolhol_vol_pct, energy_kcal_100ml and original_wort:
data |> explore(energy_kcal_100ml, alcohol_vol_pct, color = "gold")
data |> explore(original_wort, alcohol_vol_pct, color = "gold")
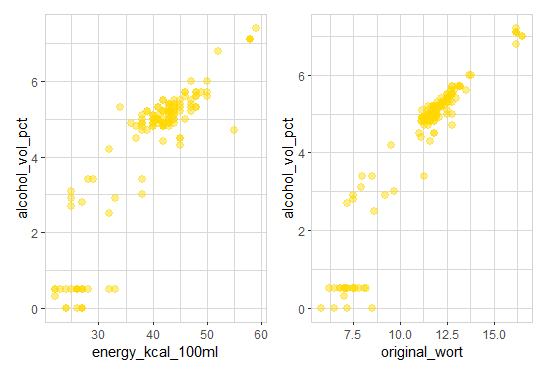
Both, energy_kcal_100ml and original_wort have a strong relationship with alcohol_vol_pct
Then we check the relationship between carb_g_100ml, alcohol_vol_pct and type
data |>
  explore(alcohol_vol_pct, carb_g_100ml,
          target = type,
          color = c("blue","red", "gold")))
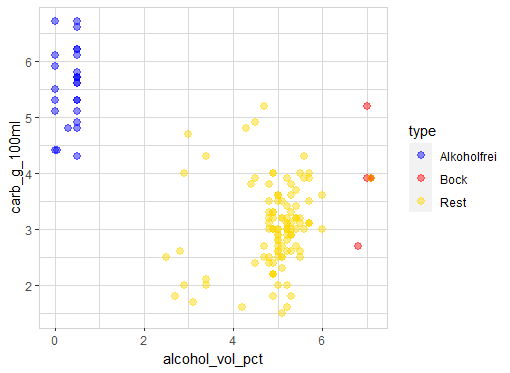
There is a clear pattern: beers with high carb tend to have very low alcohol (type = Alkoholfrei)
More sugar, more kcal?
We test the hypothesis: “the more sugar a beer contains, the more energy (kcal/100ml)”
data |>
  explore(sugar_g_100ml, energy_kcal_100ml, color = "gold")
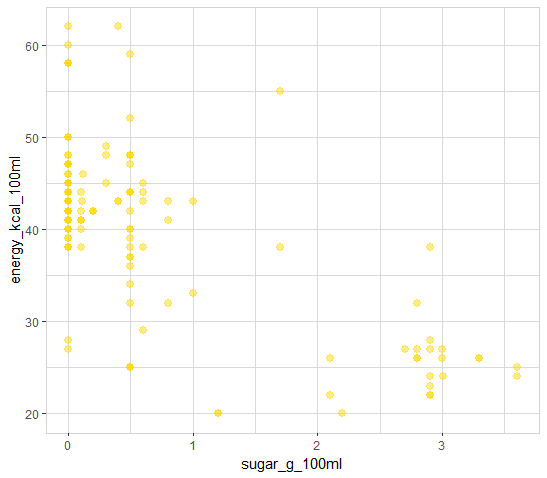
There seems to be a relationship between sugar and energy, but the higher the sugar, the lower the energy (kcal/100ml). Let’s check the other attributes too!
Correlations with sugar
data |>
  select(country, year, type, color_dark, sugar_g_100ml) |>
  explore_all(target = sugar_g_100ml, color = "gold")
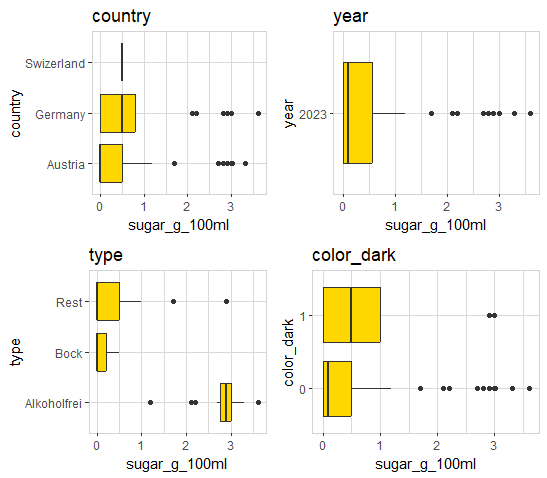
Beer type “Alkoholfrei” (alcohol free) has clearly the highest amount of sugar. Beer type “Bock” has the lowest amount of sugar. The main difference between type “Bock” and “Alkoholfrei” is the amount of alcohol.
data |>
  select(alcohol_vol_pct, original_wort, energy_kcal_100ml, carb_g_100ml, sugar_g_100ml) |>
  explore_all(target = sugar_g_100ml, color = "gold")
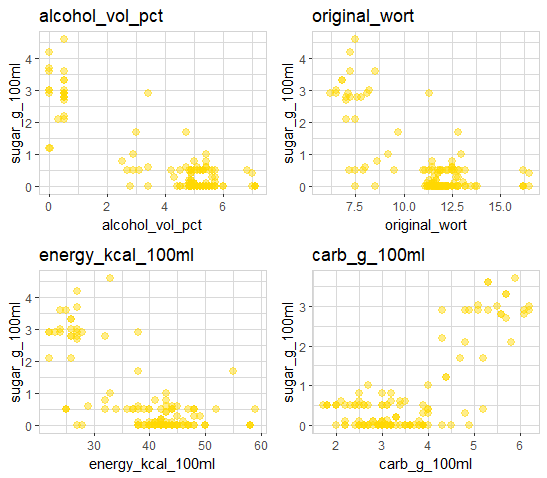
All 4 attributes show a correlation with sugar! carb_g_100ml shows a positive correlation (the higher carb_g_100ml the higher sugar). The other 3 attributes show a negative correlation (the higher the attribute the lower sugar).
Explain sugar
Decision Tree
Ok, it seeems that sugar is depending not just on one single attribute. To explain sugar, we use the machine learning algorithm “Decision Tree”:
data |>
  explain_tree(target = sugar_g_100ml)
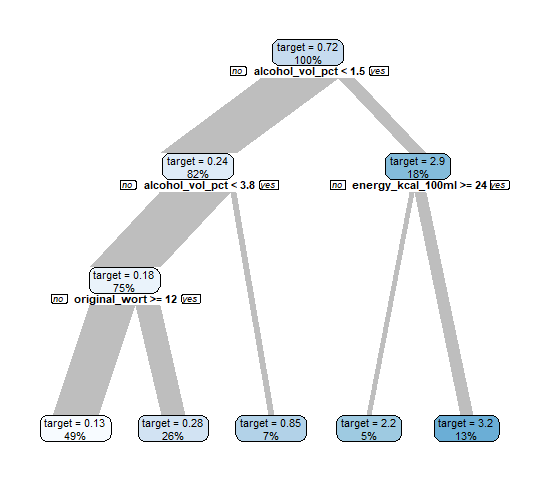
The decision tree explains the relationship between sugar with the other attributes alcohol_vol_pct, energy_kcal_100_ml and original_wort.
So, if the beer contains less than 1.5% alcohol in 100 ml, then it contains more sugar (in average 2.9 g / 100ml). If the beer contains more than 1.5% alcohol in 100 ml,
then the beer contains a low amount of sugar. The lowest sugar have beer with > 3.8% alcohol in 100 ml and original_wort < 12.
Random Forest
Now let’s use a more detailed machine learning algorithm: “Random Forest” to explain sugar in beer.
data |>
  drop_obs_with_na() |>
  explain_forest(target = sugar_g_100ml)
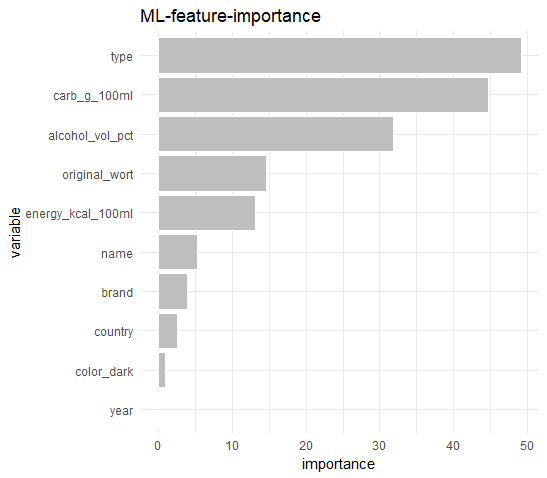
We can see sugar depends on many attributes. alcohol_vol_pct, energy_kcal_100ml and original_wort are still in the model, but the “Random Forest” rank other attributes higher. The strongest are:
type: as we already saw that beer-type “Alkoholfrei” contains the highest amount of sugarcarb_g_100ml: as sugar is a type of carb (carbohydrates)alcohol_vol_pct: as we saw that higher alcohol means lower sugar
original_wortand energy_kcal_100ml have a medium impact on sugar.
The rest of the attributes are less important (and not convincing).
Conclusion
Yes, beer can contain sugar (even if it doesn’t taste sweet). You can expect alcohol free or low alcohol beers to contain more sugar. But these beers have lower engergy (kcal / 100 ml) compared to an average beer with typical alcohol.