
Esoteric Patterns
What we can learn from Esoteric Pattern (using R)
Setup
If {explore} is not installed, install it from CRAN (you need explore 1.2.0 or higher)
install.packages("explore")
Then we can use it to create (and explore) some “esoteric data”
library(explore)
data <- create_data_esoteric()
Let’s see how the data looks like:
data |> describe_tbl()
1 000 (1k) observations with 6 variables
0 observations containing missings (NA)
0 variables containing missings (NA)
0 variables with no variance
data |> describe_all()
# A tibble: 6 × 8
  variable        type     na na_pct unique   min  mean   max
  <chr>           <chr> <int>  <dbl>  <int> <dbl> <dbl> <dbl>
1 starsign        chr       0      0     12    NA NA       NA
2 chinese         chr       0      0     12    NA NA       NA
3 moon            chr       0      0      4    NA NA       NA
4 blood           chr       0      0      8    NA NA       NA
5 fingers_crossed int       0      0      2     0  0.17     1
6 success         int       0      0      2     0  0.51     1
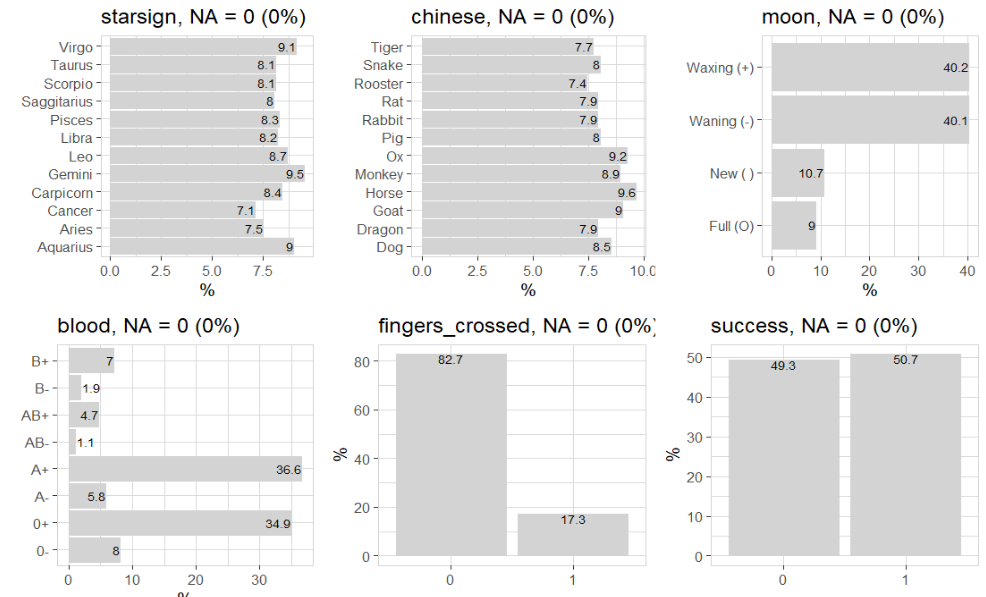
So we have a dataset with 1000 observations and 6 variables. Let’s take a closer look:
data |> explore_all()
The obvious question is: is there a correlation between success and the other variables:
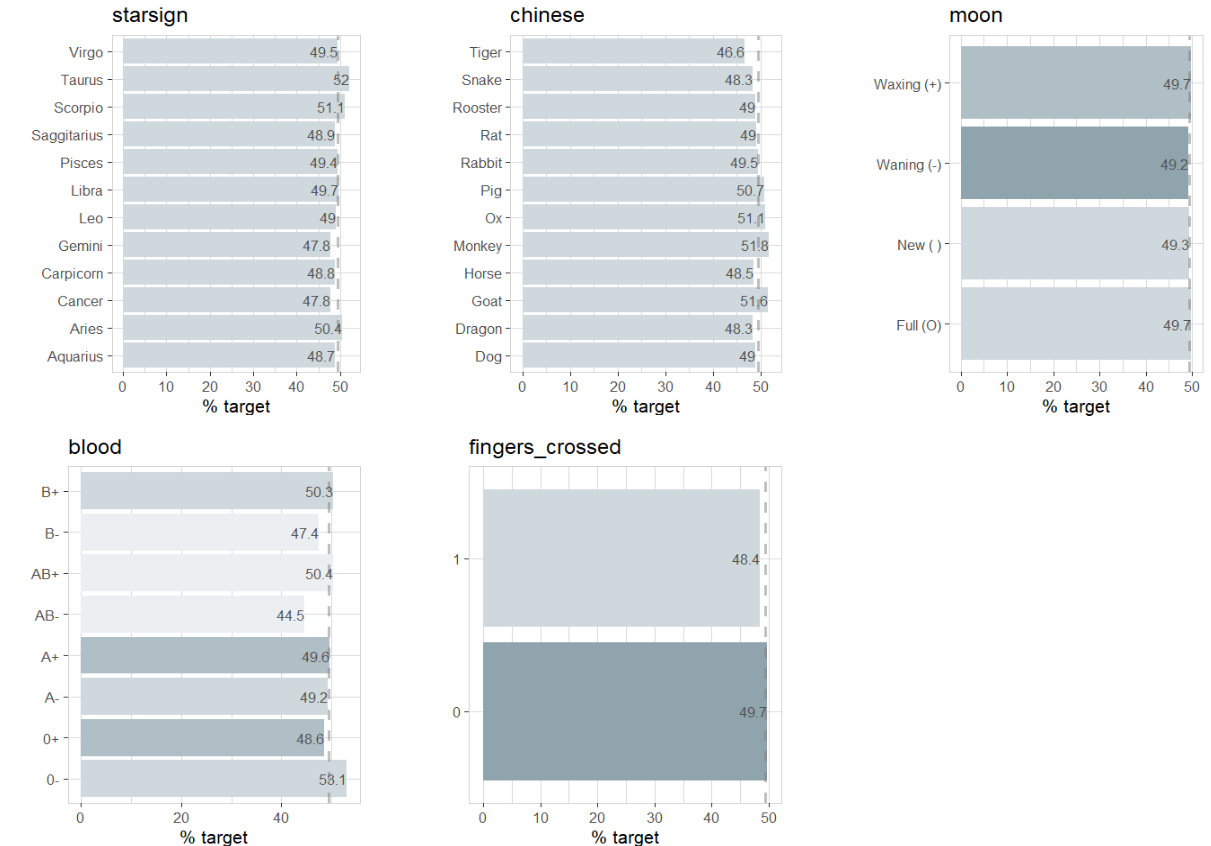
data |> explore_all(target = success, targetpct = TRUE)
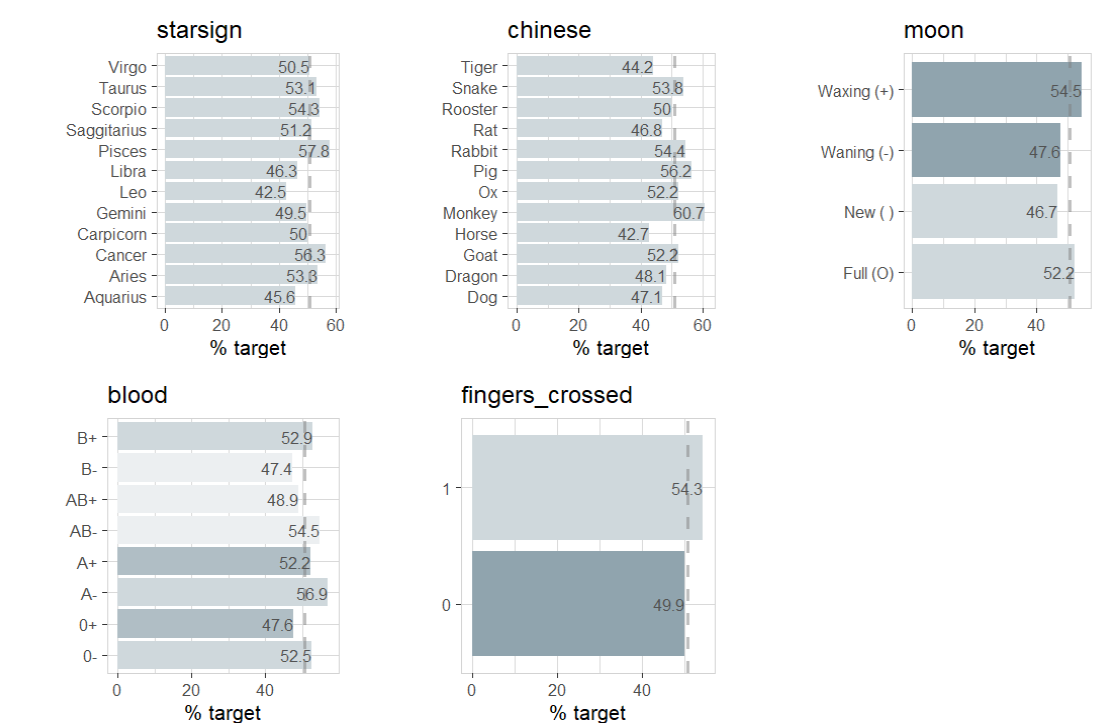
Ok, there are some intersting correlations. But what does that actually mean? Does starsign “Pisces”, chinese zodiac “Monkey”, a waxing moon, blood type A- or keeping fingers crossed have a positive impact on success?
What if these patterns are just random? We can find out by testing if these patterns are statistically significant:
data |> abtest(starsign == "Pisces", target = success)
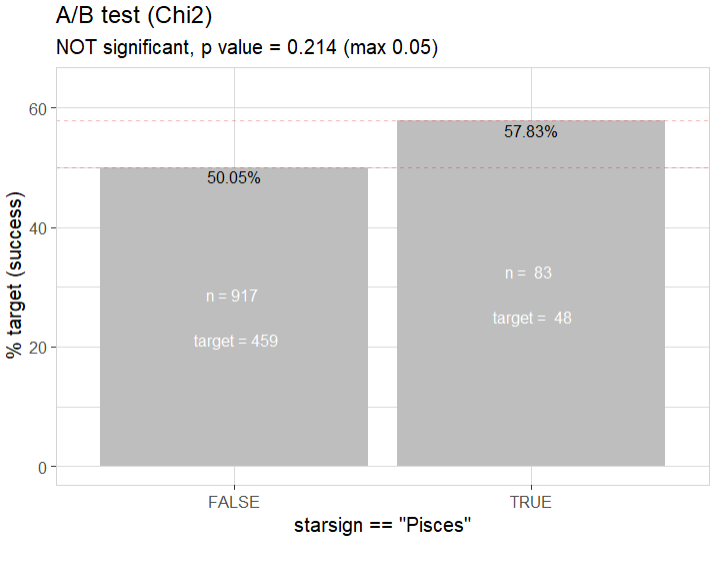
The A/B test shows, that the relationship between starsign “Pisces” and success is not statistically significant. People with starsign “Pisces” have a higher chance of success (in this data), but this seems to be only a random pattern, not a real correlation (or causation).
We can A/B test all the other variables too
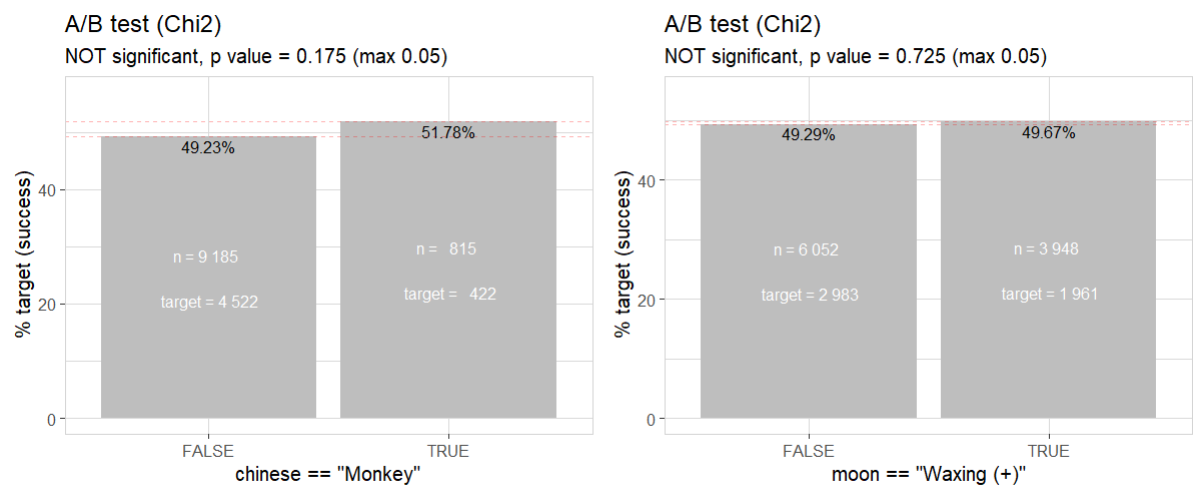
data |> abtest(chinese == "Monkey", target = success)
data |> abtest(moon == "Waxing (+)", target = success)
data |> abtest(blood == "A-", target = success)
data |> abtest(fingers_crossed == "A-", target = success)
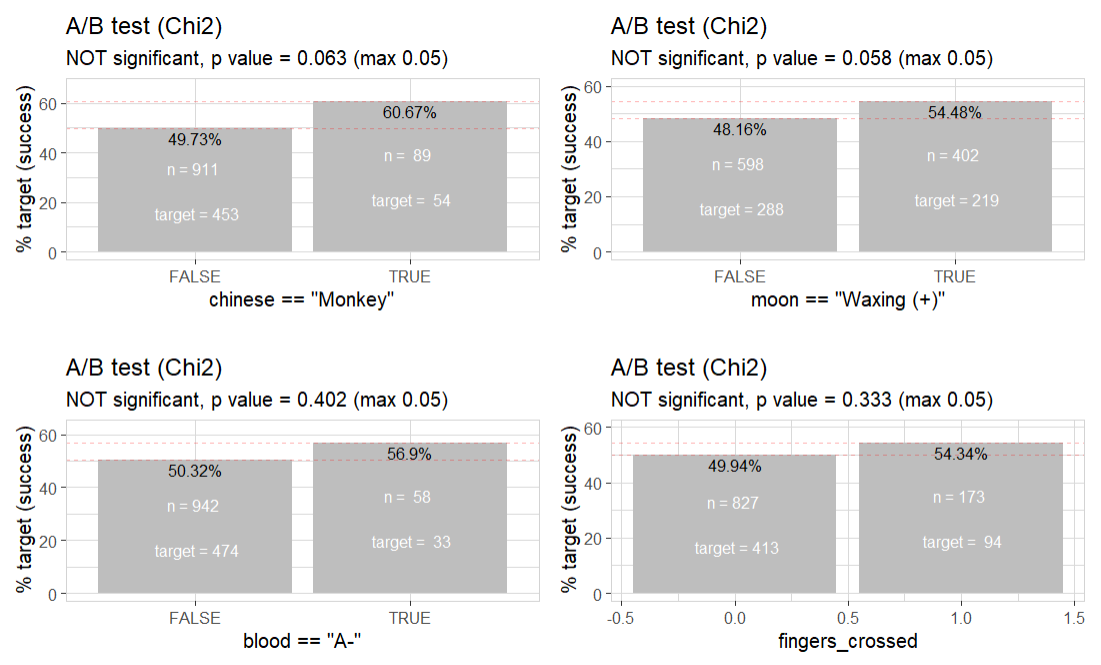
All are not statistically significant (but chinese zodiac “Monkey” and waxing moon are quite close)!
An esoteric minded person could argue, that it tolally makes sense that chinese zodiac “Monkey” and waxing moon tend to have more success, as monkeys are very smart and agile. And a waxing moon is an “increasing” moon, so it can increase success too.
But as a data scientist, we only care about data. What does data tell us about all this?
Well, we have only 1000 observations in the data. So we could get more data and look if these patterns are still there:
data <- create_data_esoteric(obs = 10000, seed = 2)
When exploring the patterns of 10 000 (new) observations, the “esoteric patterns” are getting much smaller or are completely gone.
If we check again chinese zodiac “Monkey” and waxing moon for significance:
They are no loger “close to statistically significant” anymore.
So, the lower the number of observations, the easier it is to find such “esoteric patterns”. Be aware of them!