
Deal with extreme values
{explore} the missleading power of extreme values!
Data
In this example we are using a dataset from {explore}
library(tidyverse)
library(explore)
data <- use_data_buy(obs = 100)
We get a dataframe with 100 observations and 13 variables:
data |> describe()
# A tibble: 13 × 8
   variable        type     na na_pct unique    min      mean    max
   <chr>           <chr> <int>  <dbl>  <int>  <dbl>     <dbl>  <dbl>
 1 period          int       0      0      1 202012 202012    202012
 2 buy             int       0      0      2      0      0.53      1
 3 age             int       0      0     41     24     52.6      92
 4 city_ind        int       0      0      2      0      0.49      1
 5 female_ind      int       0      0      2      0      0.53      1
 6 fixedvoice_ind  int       0      0      2      0      0.08      1
 7 fixeddata_ind   int       0      0      1      1      1         1
 8 fixedtv_ind     int       0      0      2      0      0.43      1
 9 mobilevoice_ind int       0      0      2      0      0.68      1
10 mobiledata_prd  chr       0      0      3     NA     NA        NA
11 bbi_speed_ind   int       0      0      2      0      0.6       1
12 bbi_usg_gb      int       0      0     56     10   1064.   100000
13 hh_single       int       0      0      2      0      0.29      1
Hypothesis
Let’s say, there is a hypothesis, that the higher the age, the higher the broadband internet usage in gigabyte (bbi_usg_gb).
We can simply calculate the correlation between age and bbi_usg_gb:
cor(data$age, data$bbi_usg_gb)
[1] 0.105514
We get a positive correlation. So did we just proof that the hypothesis is correct?
Let’s take a closer look:
Explore
We can visualise the correlation between age and bbi_usg_gb by using the explore() function.
data |> explore(age, bbi_usg_gb)
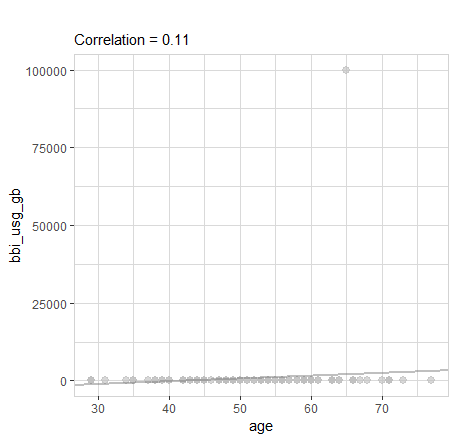
There is one single observation with a crazy high internet usage (1 Mio Gigabyte). What will happen, if we exclute this extreme value from the data?
data |>
  filter(bbi_usg_gb < 100000) |>
  explore(age, bbi_usg_gb)
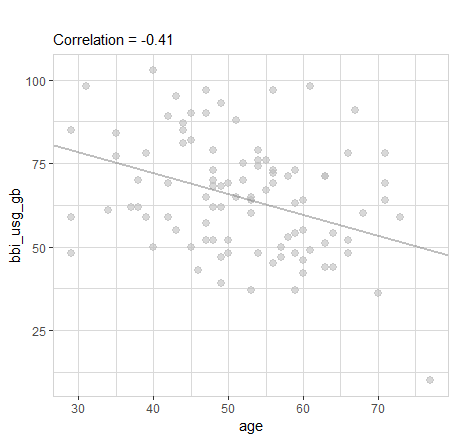
This made the correlation flip from a positive value to a negative value.
Conclusion
Never trust a correlation, always take a closer look to the data.
Use visualisations to check patterns in data, and double check with someone who has domain knowlege, if it realy makes sense.
Wanna try by yourself? Use https://github.com/rolkra/explore (you need {explore} 1.3.1 or higher)